Applied Linear Models
STAT3530 Fall 2026
Does insulation reduce energy use?
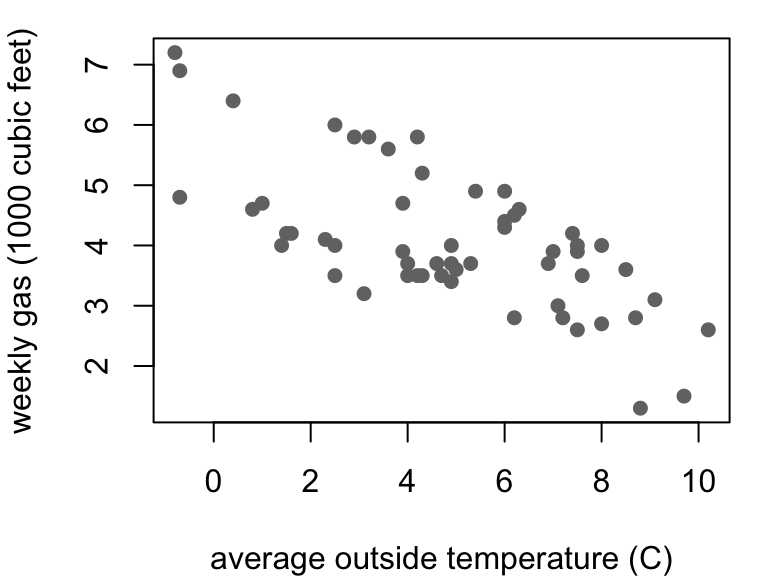
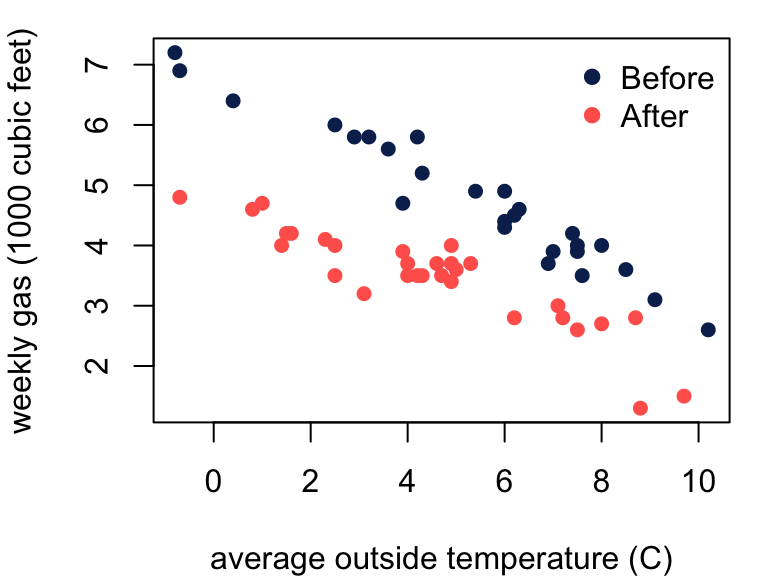
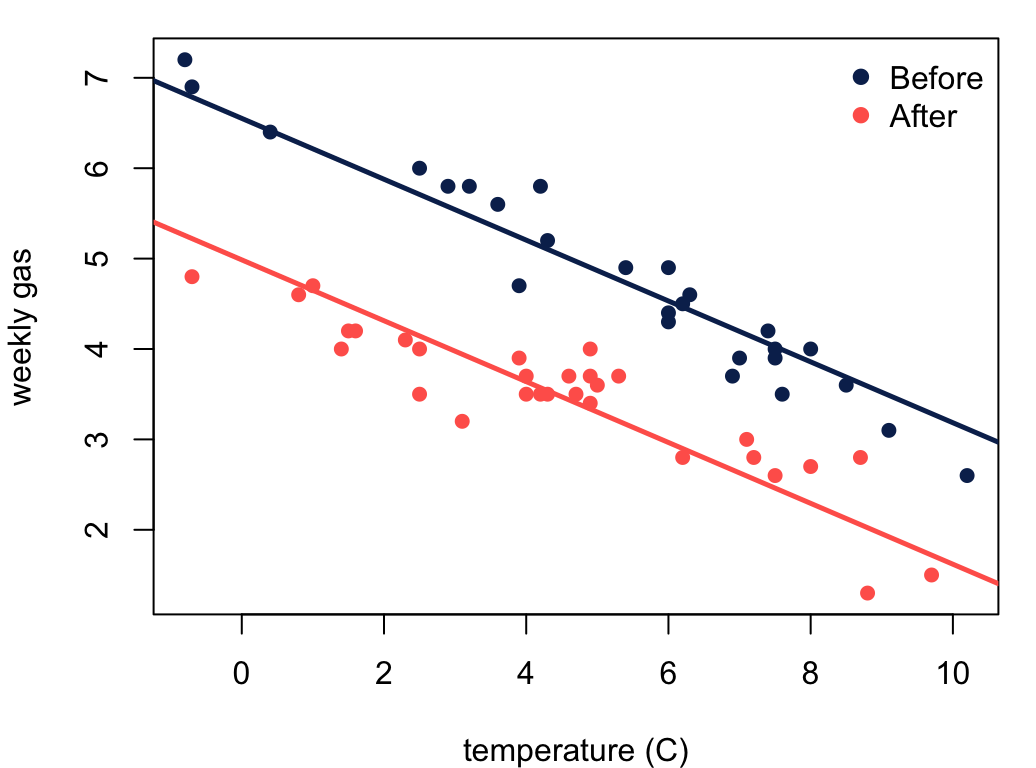
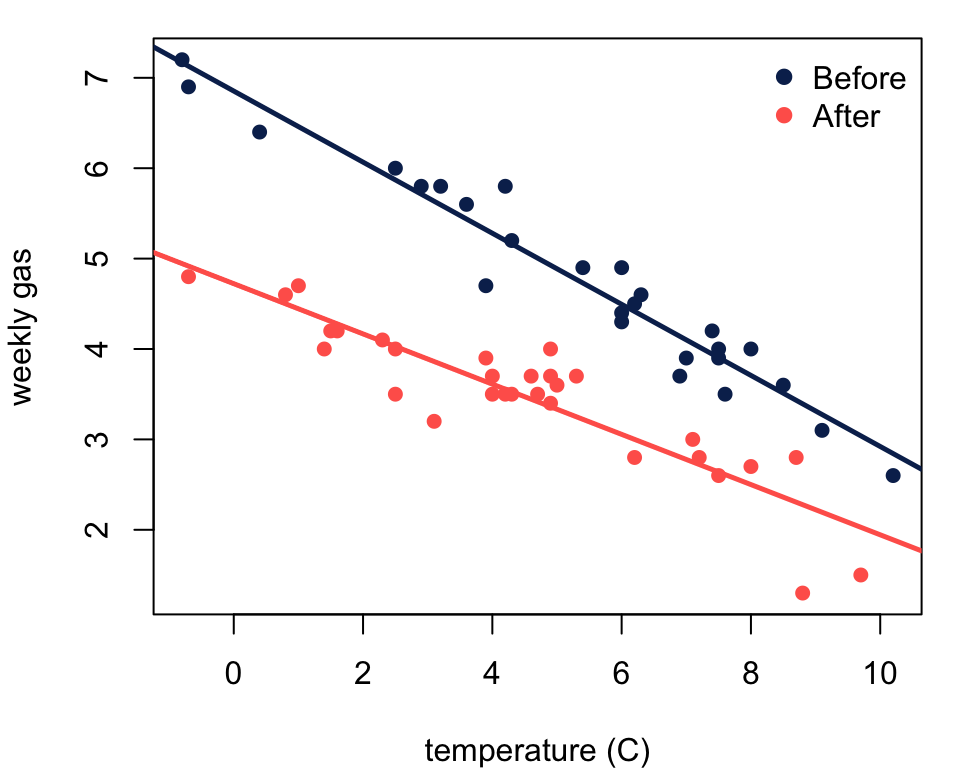
Weekly gas use and average outside temperature over 56 weeks.
Between heating seasons, the home underwent cavity-wall insulation.
Looks like there’s an effect. How do we quantify it?
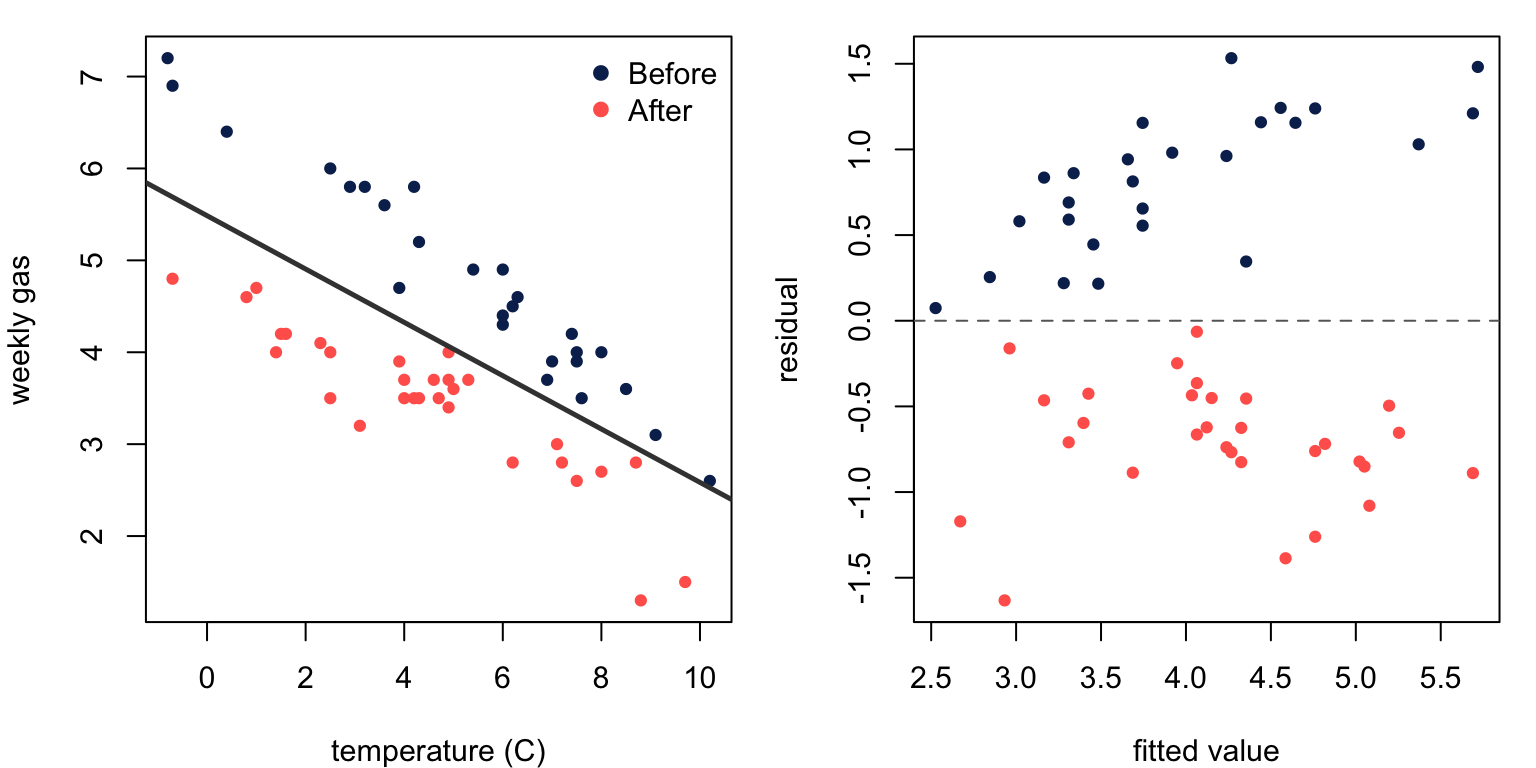
A model without insulation
A simple linear regression misses obvious structure.
Idea: add insulation as a predictor. \[
\text{gas}_i = \beta_0 + \beta_1\,\text{temp}_i + \beta_2\,\text{insulation}_i + \epsilon_i
\]
Issue: \(\beta_2 \times \text{Before} =\; ?\)
You have seen this before
Midterm: \(Y = X\beta + \epsilon\) where \[X = \left[\begin{array}{cc} 1 &0 \\ \vdots &\vdots \\ 1 &0 \\ 1 &1 \\ \vdots &\vdots \\ 1 &1\end{array}\right]
\begin{matrix}
\left.\vphantom{\begin{matrix}1\\ \vdots\\ 1\end{matrix}}\right\} \; n_0 = 47 \,\text{females}\\[0.6em]
\left.\vphantom{\begin{matrix}1\\ \vdots\\ 1\end{matrix}}\right\} \; n_1 = 97 \,\text{males}
\end{matrix}\]
Here the explanatory variable encodes the categorical variable sex:
\(x_i = 1\) for male cats\(x_i = 0\) for female cats
SLR with one categorical predictor
\[
\text{bwt}_i = \beta_0 + \beta_1\,\text{sex}_i + \epsilon_i
\]
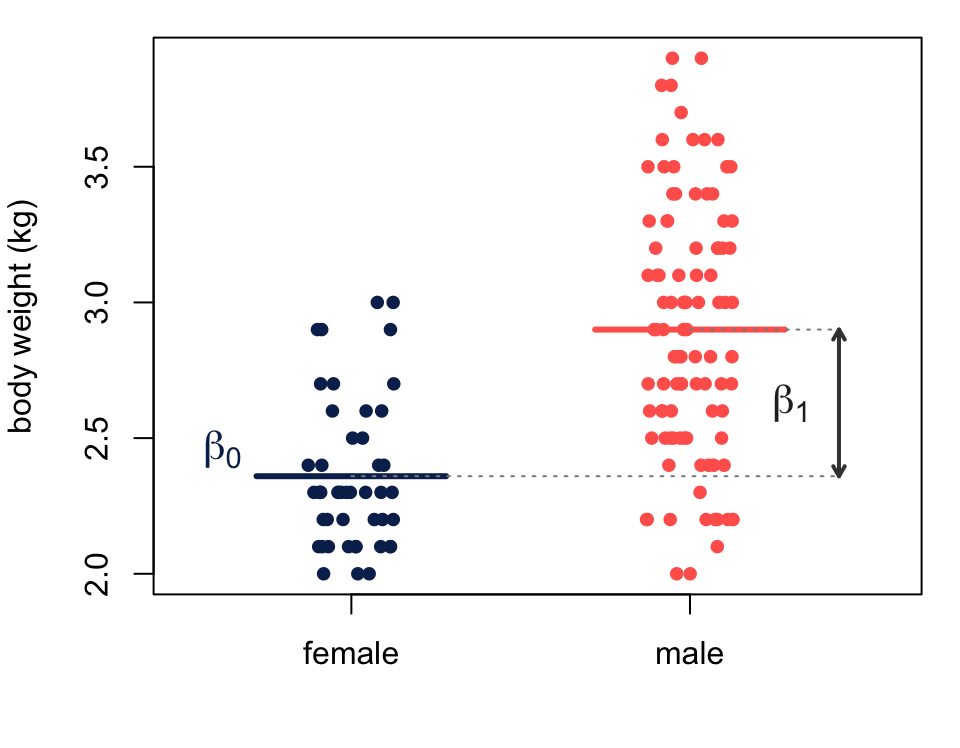
For female cats, \(\text{sex} = 0\) and \[\mathbb{E}[\text{bwt}] = \beta_0\]
For male cats, \(\text{sex} = 1\) and \[\mathbb{E}[\text{bwt}] = \beta_0 + \beta_1\]
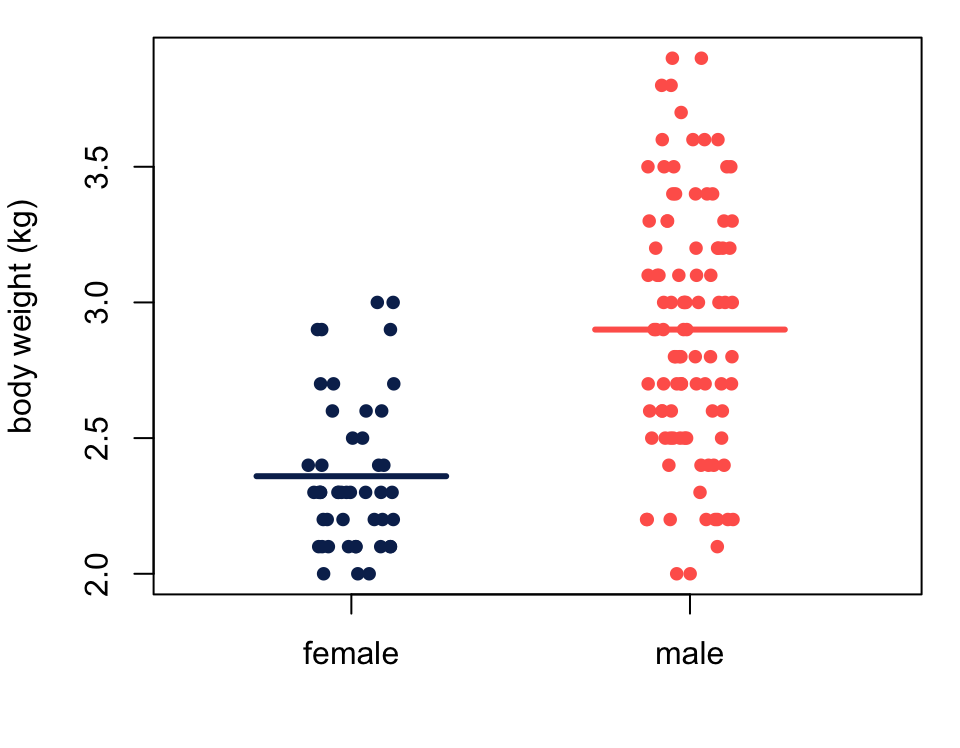
So the coefficient \(\beta_1\) is the difference in group means.
Factors in R
Categorical variables appear either as factors or character strings. Compare:
# string str (cats$ sex.chr)
chr [1:144] "F" "F" "F" "F" "F" "F" "F" "F" "F" "F" "F" "F" "F" "F" "F" ...
# factor str (cats$ sex.fct)
Factor w/ 2 levels "F","M": 1 1 1 1 1 1 1 1 1 1 ...
lm() handles both naturally
# string lm (bwt ~ sex.chr, data = cats) |> coef ()
(Intercept)    sex.chrM
  2.3595745   0.5404255
# factor lm (bwt ~ sex.fct, data = cats) |> coef ()
(Intercept)    sex.fctM
  2.3595745   0.5404255
In this case, F is the reference level, meaning that \(x_i = 0\) encodes F.
mean body weight for female cats is \(2.36\) kg
mean body weight for male cats is \(2.36 + 0.54 = 2.90\) kg
Factor encodings
We can check how R interprets the categorical variable.
# check factor encoding contrasts (cats$ sex.fct)
This shows one variable, called M, that encodes F = 0 and M = 1.
But only works for factors.
# won't work with strings contrasts (cats$ sex.chr)
Error in `contrasts()`:
! contrasts apply only to factors
So what R does under the hood if you supply lm() with a string is convert to a factor with the alphabetically first level as the reference.
# convert to factor as.factor (cats$ sex.chr) |> contrasts ()# note 'a' becomes reference as.factor (c ('b' , 'a' )) |> contrasts ()
Spot the issue
Why not specify a model that encodes the factor with two indicators?
\[
\text{bwt}_i = \beta_0 + \beta_1\,\text{F}_i + \beta_2\,\text{M}_i + \epsilon_i
\quad\text{so that}\quad
X = \left[\begin{array}{ccc} 1 &1 &0 \\ \vdots &\vdots &\vdots \\ 1 &1 &0 \\ 1 &0 &1 \\ \vdots &\vdots &\vdots \\ 1 &0 &1\end{array}\right]
\]
The indicators sum to the intercept column, so \(X\) is not full rank.
Aside. But you could drop the intercept and specify the model: \[
\text{bwt}_i = \beta_1\,\text{F}_i + \beta_2\,\text{M}_i + \epsilon_i
\] So there are other possible encodings. We will see more in ANOVA.
An energy use model
Encode the insul variable: reference level is Before.
# factor encoding for insulation contrasts (whiteside$ insul)
Now add it to the model:
\[
\text{gas}_i = \beta_0 + \beta_1 \text{temp}_i + \beta_2 \text{insul}_i + \epsilon_i
\]
# fit with categorical predictor <- lm (gas ~ temp + insul, data = whiteside)coef (fit)
(Intercept)        temp  insulAfter
   6.551329   -0.336697   -1.565205
Note that this is a single model that describes two parallel lines.
Coefficient interpretation
\[
\text{gas}_i = \beta_0 + \beta_1 \text{temp}_i + \beta_2 \text{insul}_i + \epsilon_i
\] Consider what happens to the model equation for each group:
\(\text{insul} = 0 \quad\Rightarrow\quad \mathbb{E}[\text{gas}] = \beta_0 + \beta_1 \text{temp}\) \(\text{insul} = 1 \quad\Rightarrow\quad \mathbb{E}[\text{gas}] = (\beta_0 + \beta_2) + \beta_1 \text{temp}\)
So:
\(\beta_1\) describes the association with \(\text{temp}\) across both groups\(\beta_0\) is the intercept for the reference group (before insulation)\(\beta_0 + \beta_2\) is the intercept for the other group (after insulation)
And thus \(\beta_2\) is the difference in means, i.e. , the effect of insulation.
Inference
What is the effect of insulation on mean gas consumption for this house?
Easy to answer with a confidence interval.
# confidence interval confint (fit)['insulAfter' , ]
    2.5 %    97.5 %
-1.759869 -1.370540
With 95% confidence, insulation is estimated to lower mean gas consumption by between 1,371 and 1,760 cubic feet per week at any given time in the season.
Remark. The causal interpretation only works if we assume no interannual effects and no unmeasured confounding.
Different slopes
Two (equivalent) reasons to consider different slopes here:
the effect of insulation could depend on external temperature
the association between temperature and gas use might change with insulation
To allow this, we add an interaction , or product term, between temperature and insulation:
\[\text{gas}_i = \beta_0 + \beta_1 \text{temp}_i + \beta_2 \text{insul}_i + \beta_3 (\text{temp}_i \times \text{insul}_i) + \epsilon_i\]
Now rewriting the model equation by group gives
\(\text{insul} = 0 \quad\Rightarrow\quad \mathbb{E}[\text{gas}] = \beta_0 + \beta_1 \text{temp}\) \(\text{insul} = 1 \quad\Rightarrow\quad \mathbb{E}[\text{gas}] = (\beta_0 + \beta_2) + (\beta_1 + \beta_3) \text{temp}\)
So \(\beta_2\) is the difference in intercepts, and \(\beta_3\) is the difference in slopes.
Fitting with interactions
Two ways, syntactically, via lm():
lm (gas ~ temp * insul, data = whiteside)lm (gas ~ temp + insul + temp: insul, data = whiteside)
Algebraically, the model matrix here is: \[X = \left[\begin{array}{cccc}
1 &x_1 &0 &0 \\
\vdots &\vdots &\vdots &\vdots \\
1 &x_{26} &0 &0 \\
1 &x_{27} &1 &x_{27} \\
\vdots &\vdots &\vdots &\vdots \\
1 &x_{56} &1 &x_{56}
\end{array}\right]\]
Check some example rows:
   (Intercept) temp insulAfter temp:insulAfter
1            1 -0.8          0             0.0
2            1 -0.7          0             0.0
27           1 -0.7          1            -0.7
28           1  0.8          1             0.8
Do the slopes differ?
Check the partial test on \(\beta_3\) :
<- lm (gas ~ temp * insul, data = whiteside)summary (fit.int)$ coefficients
                  Estimate Std. Error    t value     Pr(>|t|)
(Intercept)      6.8538277 0.13596397  50.409146 7.997414e-46
temp            -0.3932388 0.02248703 -17.487358 1.976009e-23
insulAfter      -2.1299780 0.18009172 -11.827185 2.315921e-16
temp:insulAfter  0.1153039 0.03211212   3.590665 7.306852e-04
Interpretation 1: group difference depends on continuous predictor
The data provide evidence that the effect of insulation depends on temperature.
Interpretation 2: association depends on group
The data provide evidence that the association between gas consumption and temperature depends on insulation.
Both are correct, but I favor the first in this case.
Inference, revisited
So now what is the effect of insulation?
The difference in means now depends on temperature \(t\) : \[
\underbrace{(\beta_0 + \beta_2) + (\beta_1 + \beta_3)\;t}_{\mathbb{E}[\text{gas}] \text{ when } \text{insul} = 1} -
\underbrace{\beta_0 + \beta_1\;t}_{\text{when } \text{insul} = 0}
= \beta_2 + \beta_3\; t
\]
For fixed \(t\) , this is a contrast: \[
c^T\beta
\quad\text{where}\quad
c^T = \left[\begin{array}{cccc} 0 &0 &1 &t\end{array}\right]
\]
Recentering at \(t\) makes \(\beta_2\) the desired contrast:
<- function (t) {<- lm (gas ~ I (temp - t) * insul, data = whiteside)confint (fit)['insulAfter' , ]<- c (0 , 2.5 , 5 , 7.5 , 10 )round (cbind (t = tvals, t (sapply (tvals, at))), 3 )
        t  2.5 % 97.5 %
[1,]  0.0 -2.491 -1.769
[2,]  2.5 -2.076 -1.608
[3,]  5.0 -1.730 -1.377
[4,]  7.5 -1.508 -1.022
[5,] 10.0 -1.350 -0.604
So the estimated effect is larger at lower temperature.
Many levels
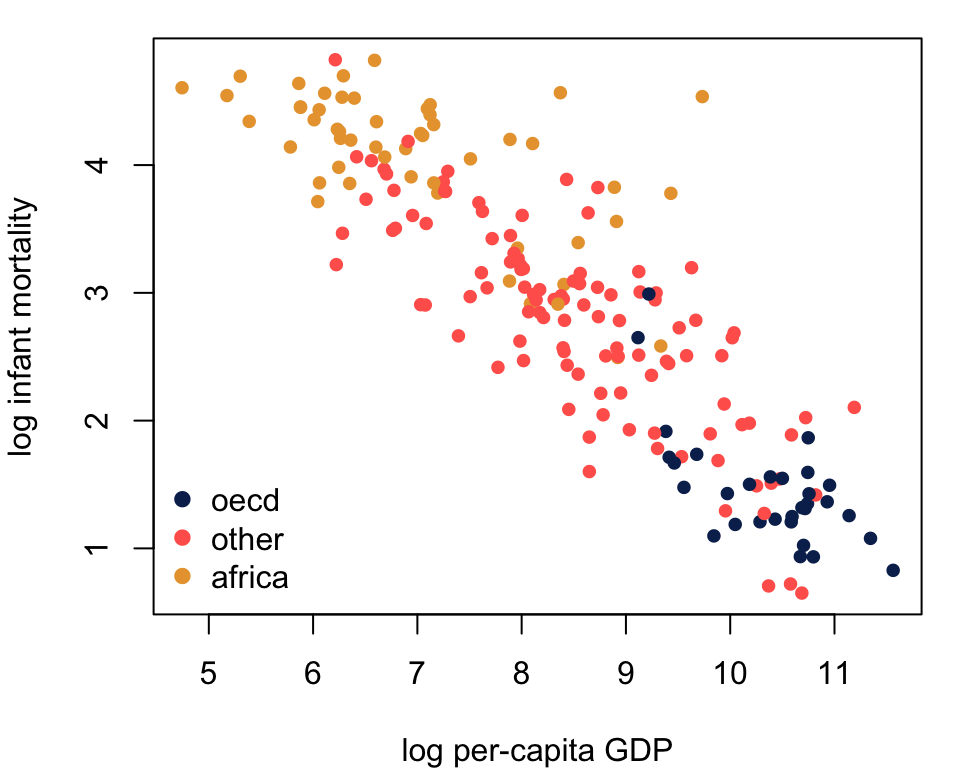
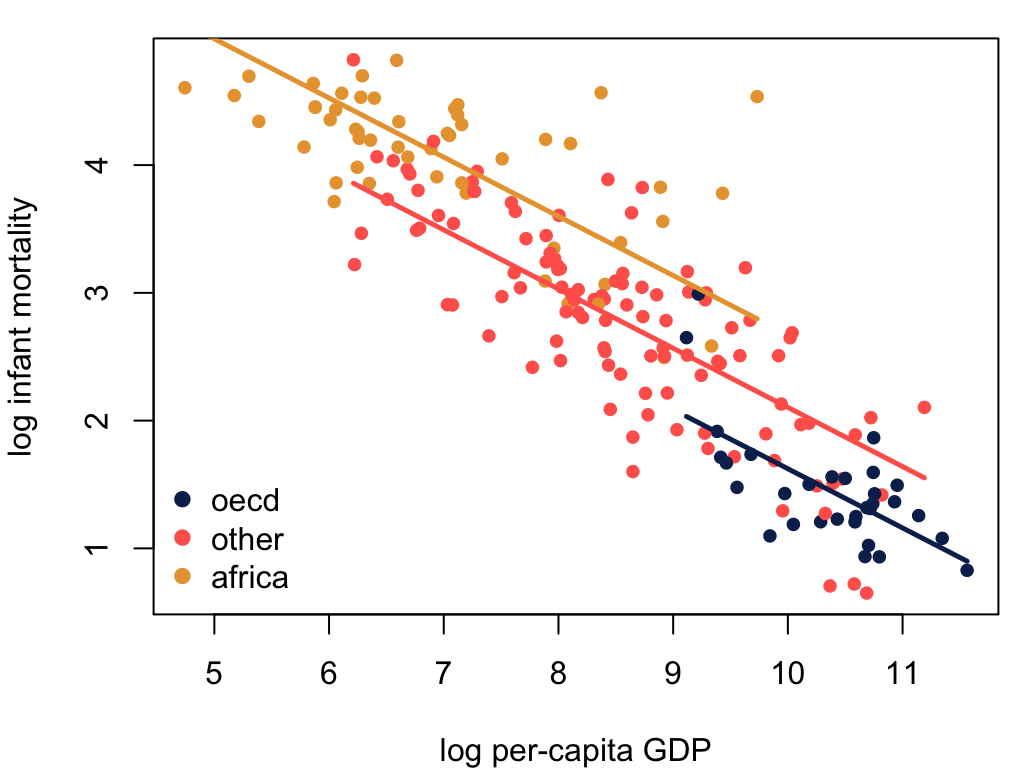
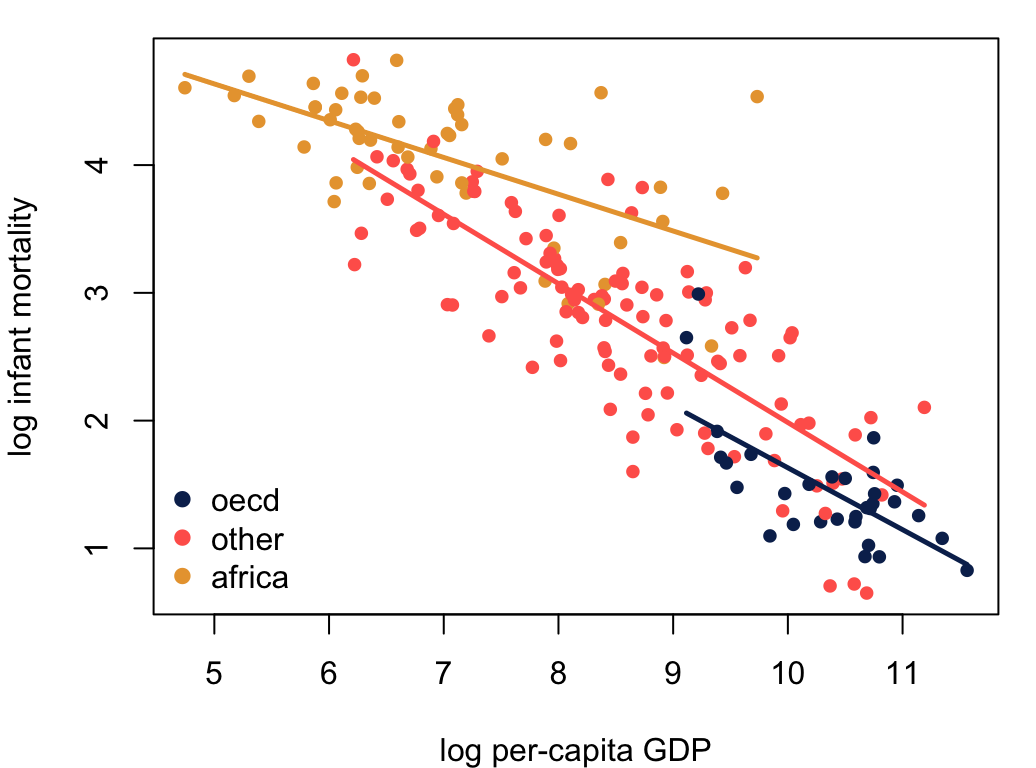
Infant mortality and per-capita GDP for 193 countries:
31 OECD countries
52 African countries
110 other countries
Does infant mortality differ by region after accounting for national income?
Two indicators for three levels
Now oecd is the reference level, and one indicator encodes each of the other levels:
       other africa
oecd       0      0
other      1      0
africa     0      1
The model without interactions (i.e. , parallel lines) is:
\[\log(\text{mort}_i) = \beta_0 + \beta_1 \log(\text{gdp}_i) + \beta_2\,\text{other}_i + \beta_3\, \text{africa}_i + \epsilon_i\]
Interpretation are relative to the reference level:
\(\beta_2\) is the difference in means between other and oecd countries\(\beta_3\) is the difference in means between africa and oecd countries
The parallel lines model
lm (lmort ~ lgdp + group, data = un) |> coef ()
(Intercept)        lgdp  groupother groupafrica
  6.2550828  -0.4631826   0.4801703   1.0491120
Estimates suggest higher mortality in African and non-OECD countries.
other: \(e^{0.48} = 1.6\) -fold increaseafrica: \(e^{1.05} = 2.9\) -fold increase
This particular comparison may be a little unreliable since GDP ranges also differ.
Inference with multiple levels
Here, partial \(t\) tests on indicators test pairwise comparisons with the reference level.
<- lm (lmort ~ lgdp + group, data = un) summary (fit)$ coef
              Estimate Std. Error    t value     Pr(>|t|)
(Intercept)  6.2550828 0.32500043  19.246383 2.068539e-46
lgdp        -0.4631826 0.03030728 -15.282882 7.389495e-35
groupother   0.4801703 0.11003259   4.363891 2.099843e-05
groupafrica  1.0491120 0.14677408   7.147801 1.867312e-11
Each group differs significantly from oecd.
But testing whether the categorical variable is a significant predictor requires an \(F\) test
lm (lmort ~ lgdp, data = un) |> anova (fit)
Analysis of Variance Table

Model 1: lmort ~ lgdp
Model 2: lmort ~ lgdp + group
  Res.Df    RSS Df Sum of Sq      F    Pr(>F)
1    191 53.272
2    189 41.239  2    12.032 27.572 3.113e-11 ***
---
Signif. codes:  0 '***' 0.001 '**' 0.01 '*' 0.05 '.' 0.1 ' ' 1
The data provide evidence that median infant mortality differs by country group after adjusting for national income.
Including interactions
Same as before, but with (a lot) more terms:
\[
\text{lmort}_i = \beta_0 + \beta_1\,\text{lgdp}_i + \beta_2\,\text{oth}_i + \beta_3 \,\text{afr}_i + \beta_4 (\text{lgdp}_i \times \text{oth}_i) + \beta_5 (\text{lgdp}_i \times \text{afr}_i) + \epsilon_i
\]
The model equation, by group:
oecd
\(\beta_0\) \(\beta_1\)
other
\(\beta_0 + \beta_2\) \(\beta_1 + \beta_4\)
africa
\(\beta_0 + \beta_3\) \(\beta_1 + \beta_5\)
<- lm (lmort ~ lgdp * group, data = un)
Testing interactions
Now the interaction involves multiple terms, and slopes differ if either \(\beta_4 \neq 0\) or \(\beta_5 \neq 0\) .
So we conduct an \(F\) test of the hypothesis \[
H_0: \beta_4 = \beta_5 = 0
\]
Analysis of Variance Table

Model 1: lmort ~ lgdp + group
Model 2: lmort ~ lgdp * group
  Res.Df    RSS Df Sum of Sq      F    Pr(>F)
1    189 41.239
2    187 38.042  2    3.1972 7.8579 0.0005287 ***
---
Signif. codes:  0 '***' 0.001 '**' 0.01 '*' 0.05 '.' 0.1 ' ' 1
The slopes differ.
Changing the reference
The partial tests reflect that neither group differs from the reference.
round (summary (u2)$ coefficients, 4 )
                 Estimate Std. Error t value Pr(>|t|)
(Intercept)        6.4764     1.3384  4.8390   0.0000
lgdp              -0.4845     0.1290 -3.7576   0.0002
groupother         0.9429     1.3746  0.6859   0.4936
groupafrica       -0.4005     1.3908 -0.2879   0.7737
lgdp:groupother   -0.0589     0.1340 -0.4392   0.6610
lgdp:groupafrica   0.1966     0.1395  1.4091   0.1605
So the \(F\) test must be picking up the difference between other and africa.
Change the reference and the partial tests capture the difference.
<- transform (un, group = relevel (group, ref = 'africa' ))<- lm (lmort ~ lgdp * group, data = un2)round (summary (fit)$ coef, 4 )
                Estimate Std. Error t value Pr(>|t|)
(Intercept)       6.0759     0.3784 16.0573   0.0000
lgdp             -0.2880     0.0532 -5.4094   0.0000
groupoecd         0.4005     1.3908  0.2879   0.7737
groupother        1.3433     0.4913  2.7342   0.0069
lgdp:groupoecd   -0.1966     0.1395 -1.4091   0.1605
lgdp:groupother  -0.2554     0.0645 -3.9607   0.0001